|
Dr Ian Robinson |
|---|---|
| Physics Projects 'n Stuff |
Digital High Sensitivity Infrasound Monitor - Real Geophysics Research on a budget
This is the legacy site for the School Physics Projects. Active projects are now at schoolphysicsprojects.org . |
|---|
| Infrasound Monitor Presentation | Paper #1 | Construction Instructions |
| Tonga Event | ||
Full documentation and software on the Downloads page above
I have been working on a new geophysics project for the past three years, a compact infrasound monitor based on a digital, i2c enabled diferential pressure sensor. I feel this is a beauty. Very open-ended with lots of opportunities for students of all levels - primary to postgrad - to redesign and test replacement components. This is also real science, in a little studied area. Well suited to networking in small or large areas. Oh - and cheap! see Blog (above) for current status. A paper has been published in IOP Phys Ed.
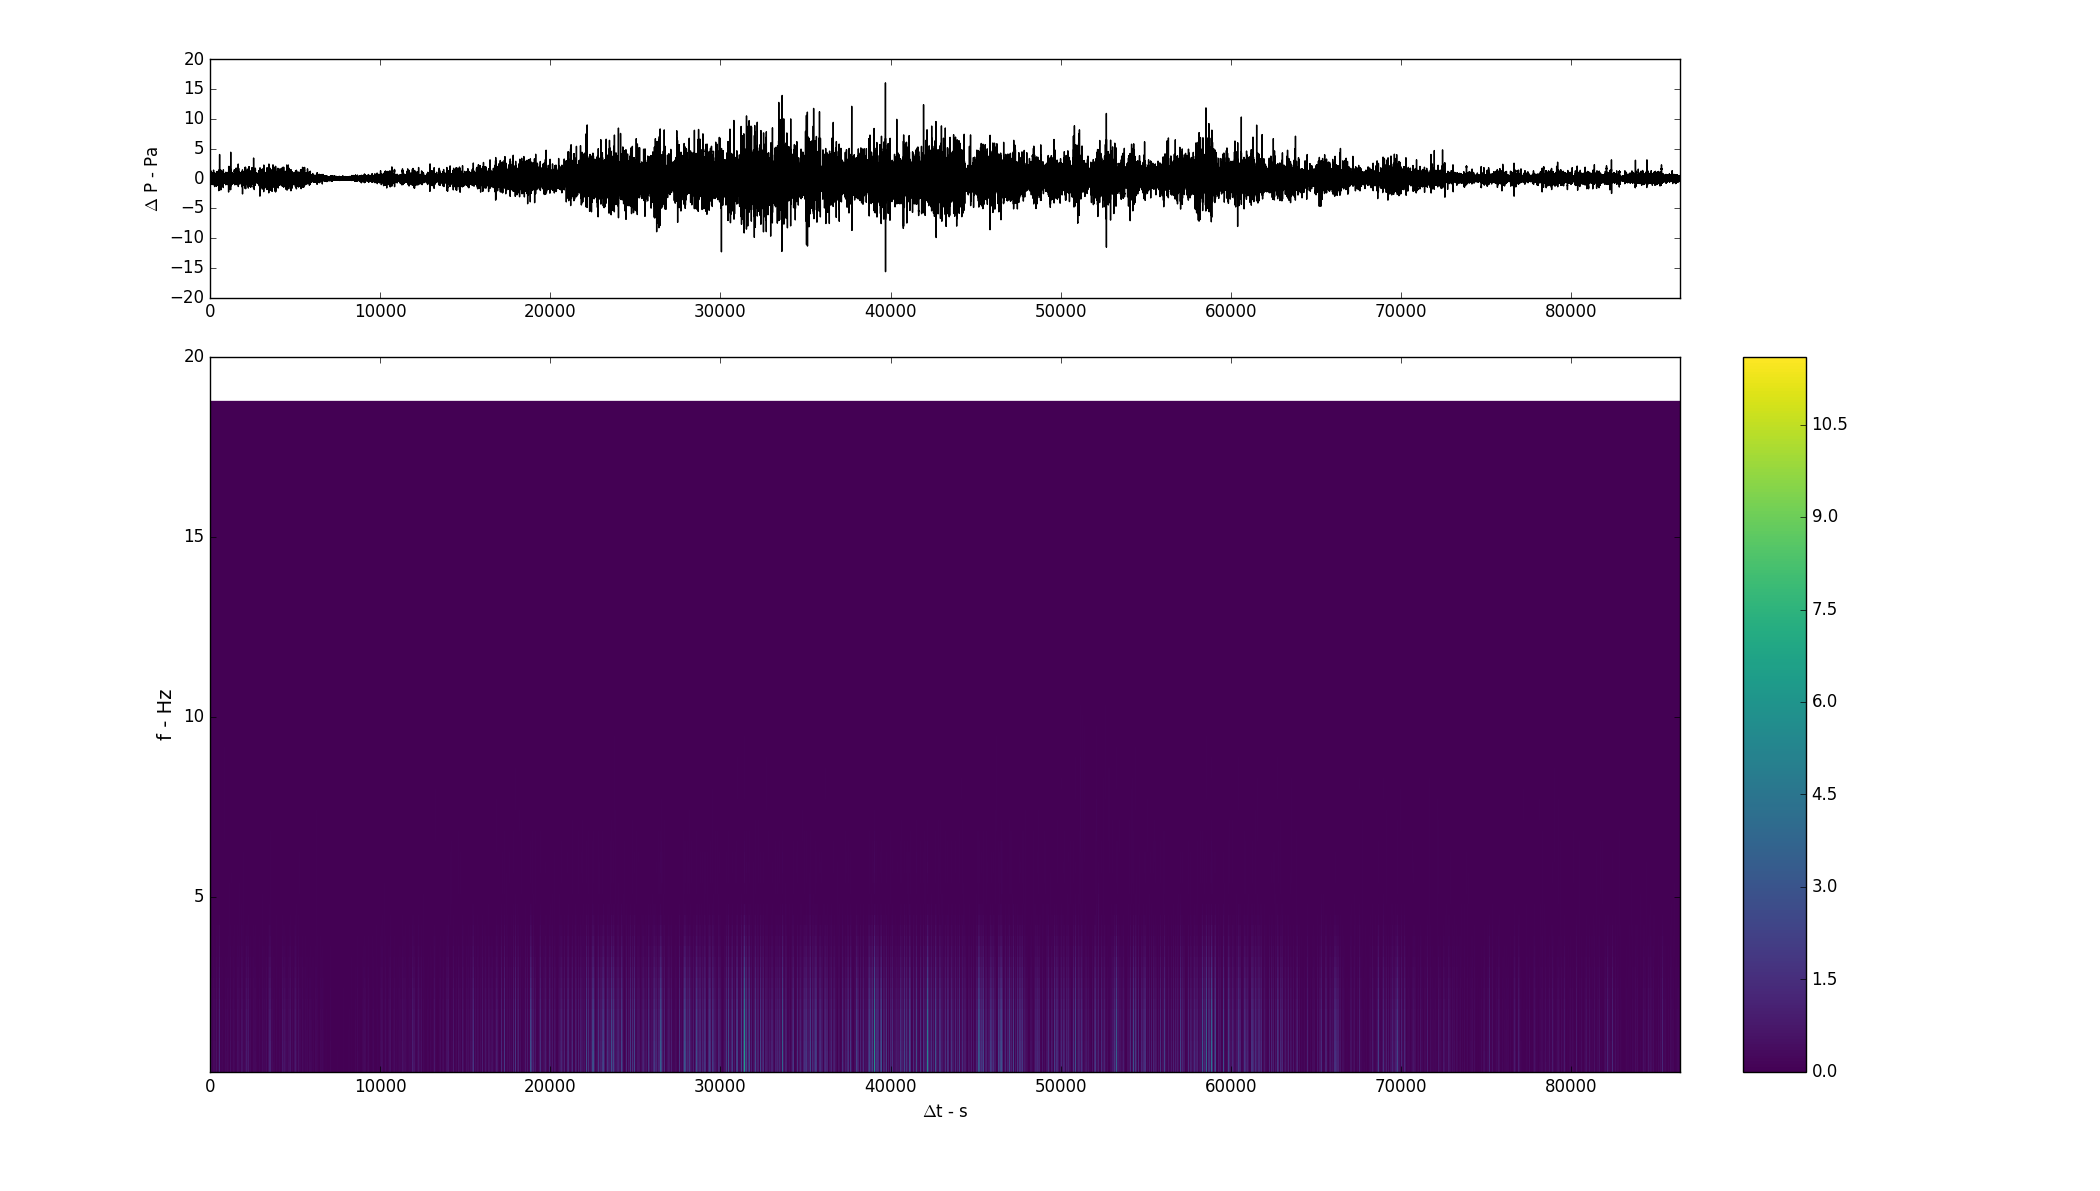
As examples of real data see Blog post for 27/7/2017 - Mean Acoustic Power - Sabic Gas Flare
or
Demonstrating f.f.t. wavelet transform of a helicopter trace the Blog post for 8/12/2019 -- Chopper!
This rig capable of resolving to better than 1 3-millionth of an atmosphere will cost less than £100 and provide plenty of valuable experience in computing, physics, electronics, and signal processing to a small team for a year or so.
Infrasound is a little studied area of geophysics/environmental science ripe for further investigation. The only U.K. detector I can find reference to is possibly one run by A.W.E. at Blacknest though precious little information is extant. A national network of school & college infrasound detectors could potentially generate useful scientific data as well as remarkable educational benefits.
Code and instructions may be downloaded here - link.
Rig Gamma will be offline occasionally being used to measure infrasound levels in cars.
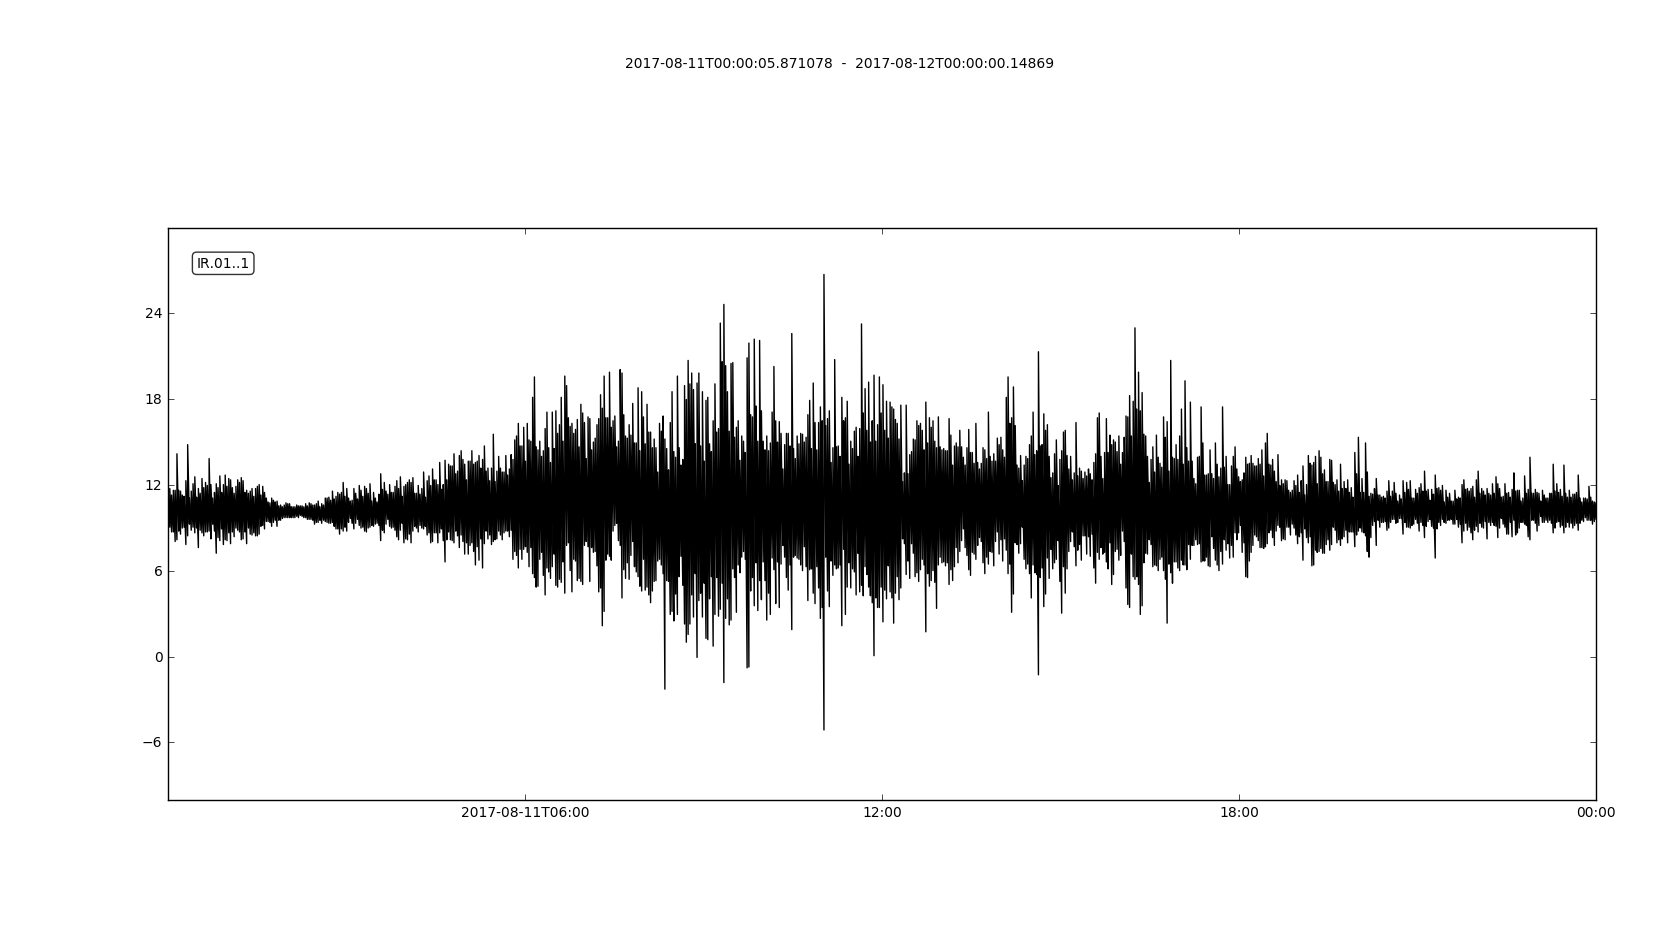
| Rig Alpha: Loftspace - pitched tile roof wind-filter - 40Hz sample rate |

|

|
|---|---|

|
|
| Rig Gamma: Outdoors - 15m porous hose on flat roof - 140Hz sample rate | |

|

|

|
| Rig A: Archived plots ... Rig B: Archived plots .. Rig G: Archived plots | |
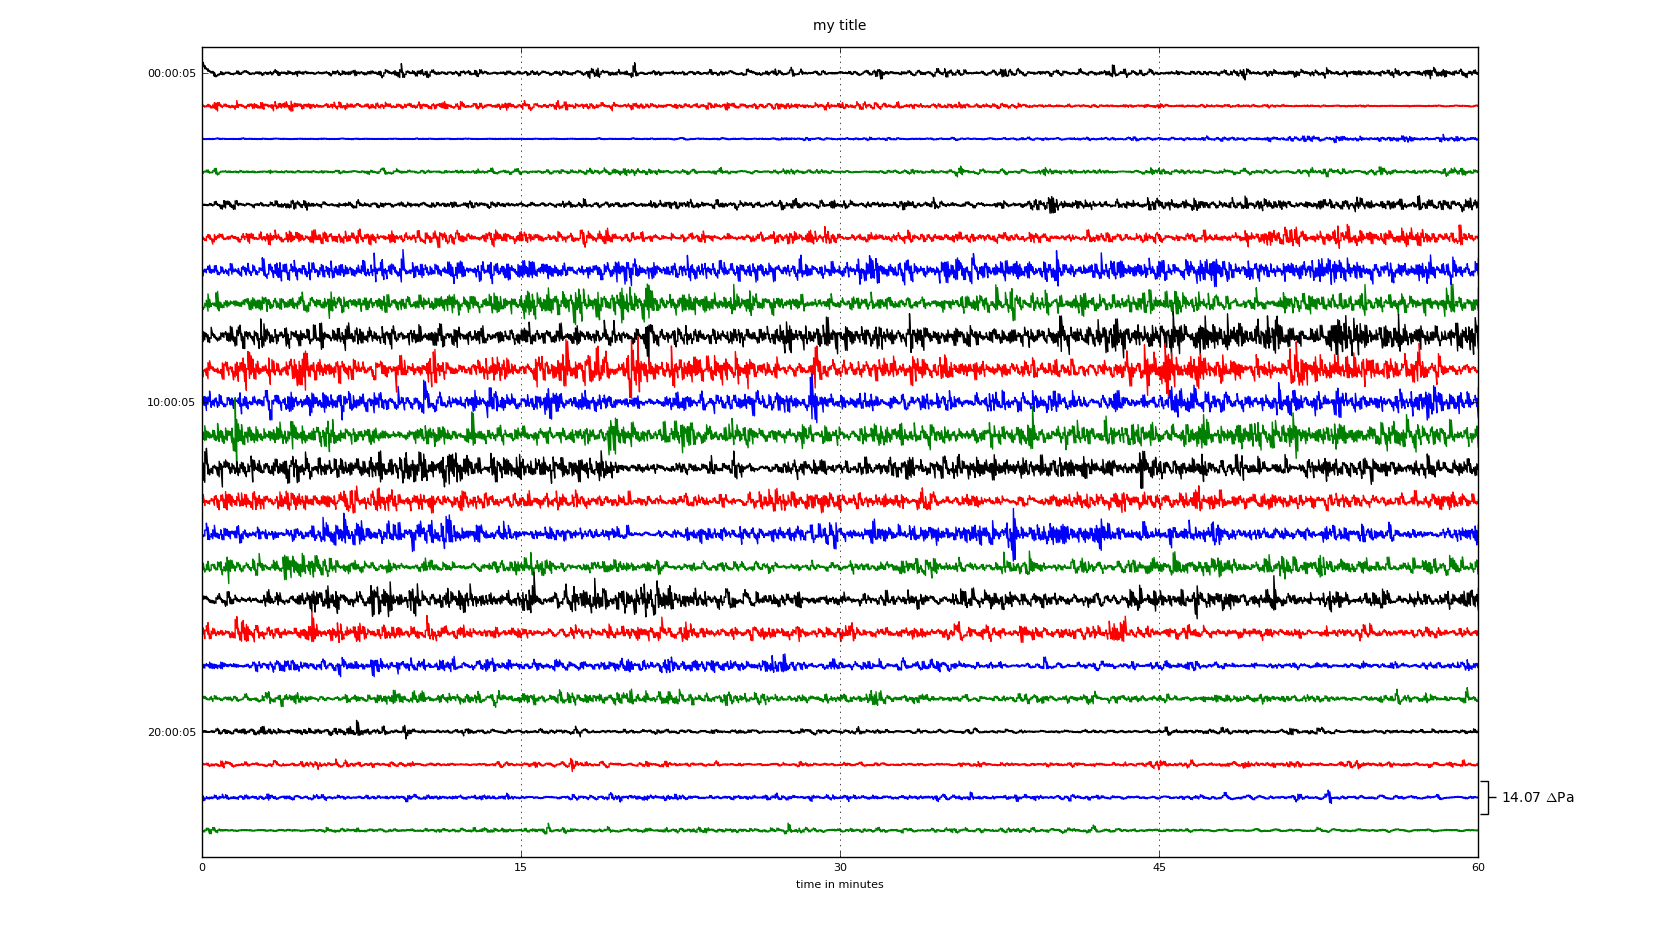
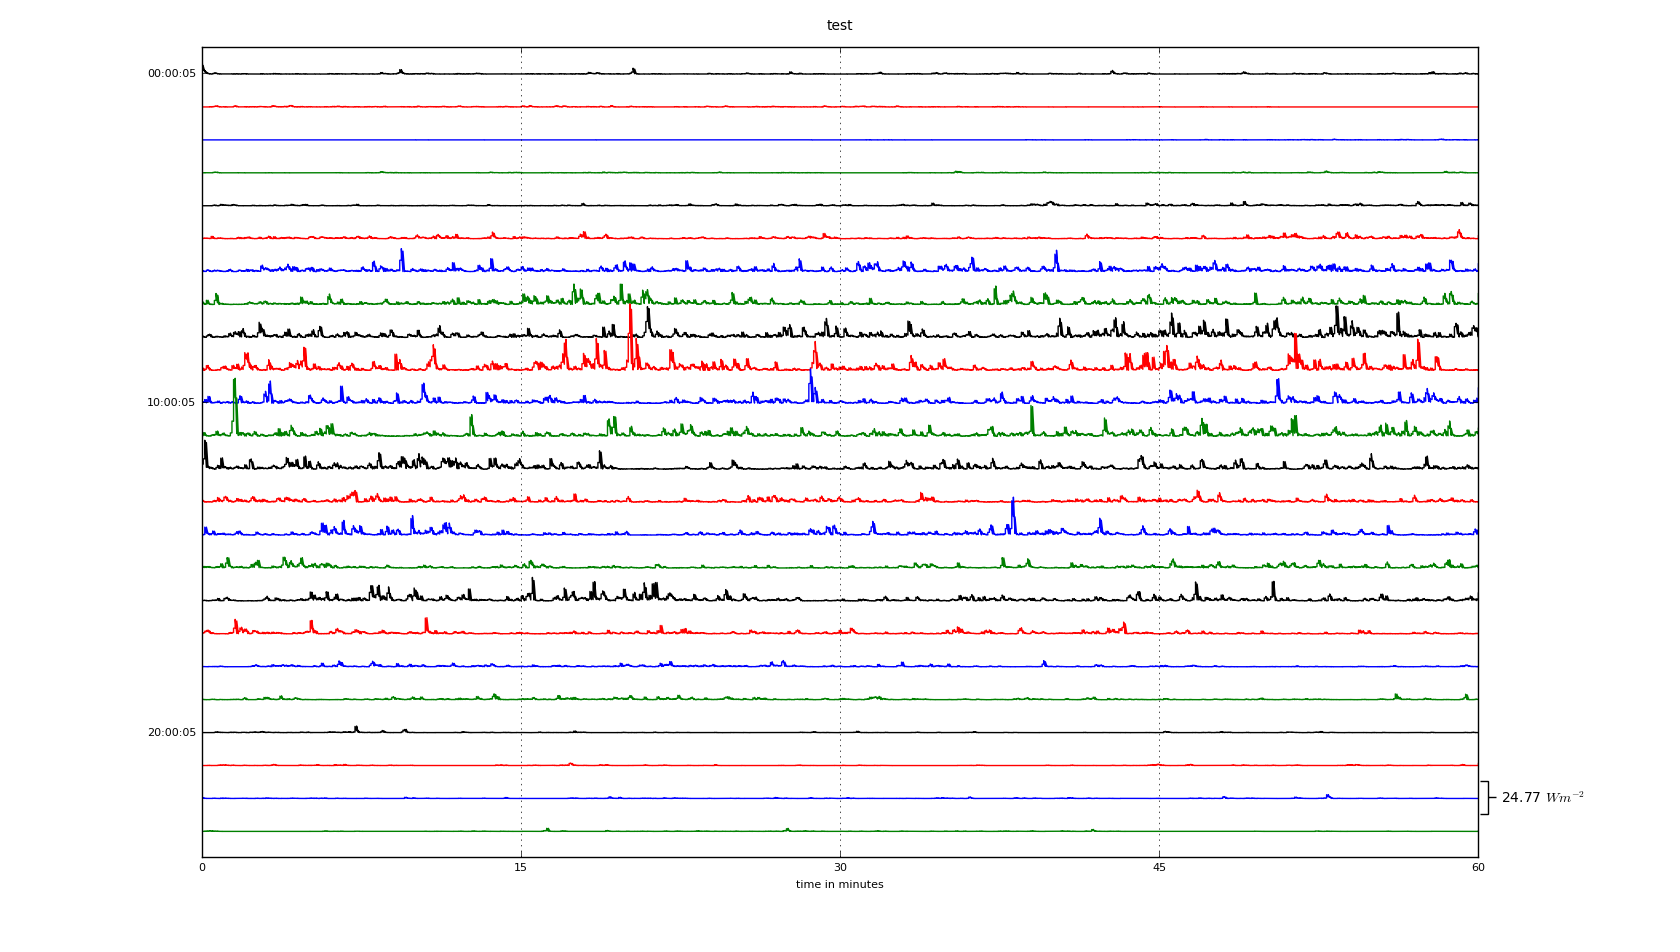
The above are simple daily data plots. These are generated on the fly by the Pi used to monitor the sensor, and should be used for quick observation of output. The idea being that the data be downloaded from the PI for more detailed analysis. I have written a general analysis tool in python for this - examples below and on the Blog page (above).
|
|
---------------------------